Lineage
Object and column level lineage can be managed by clicking on lineage icon  , found after object/attribute name. The icon is highlighted when lineage relations have already been set; when there are none it only appears once the row is hovered. New relations can be added on both levels - see Adding new relations.
Object level lineage
Object level lineage opens on the Lineage tab of the object's detailed view - via the lineage icon in the Catalog objects list or the tab itself. The embedded graph can be expanded to full screen with the Maximize button.
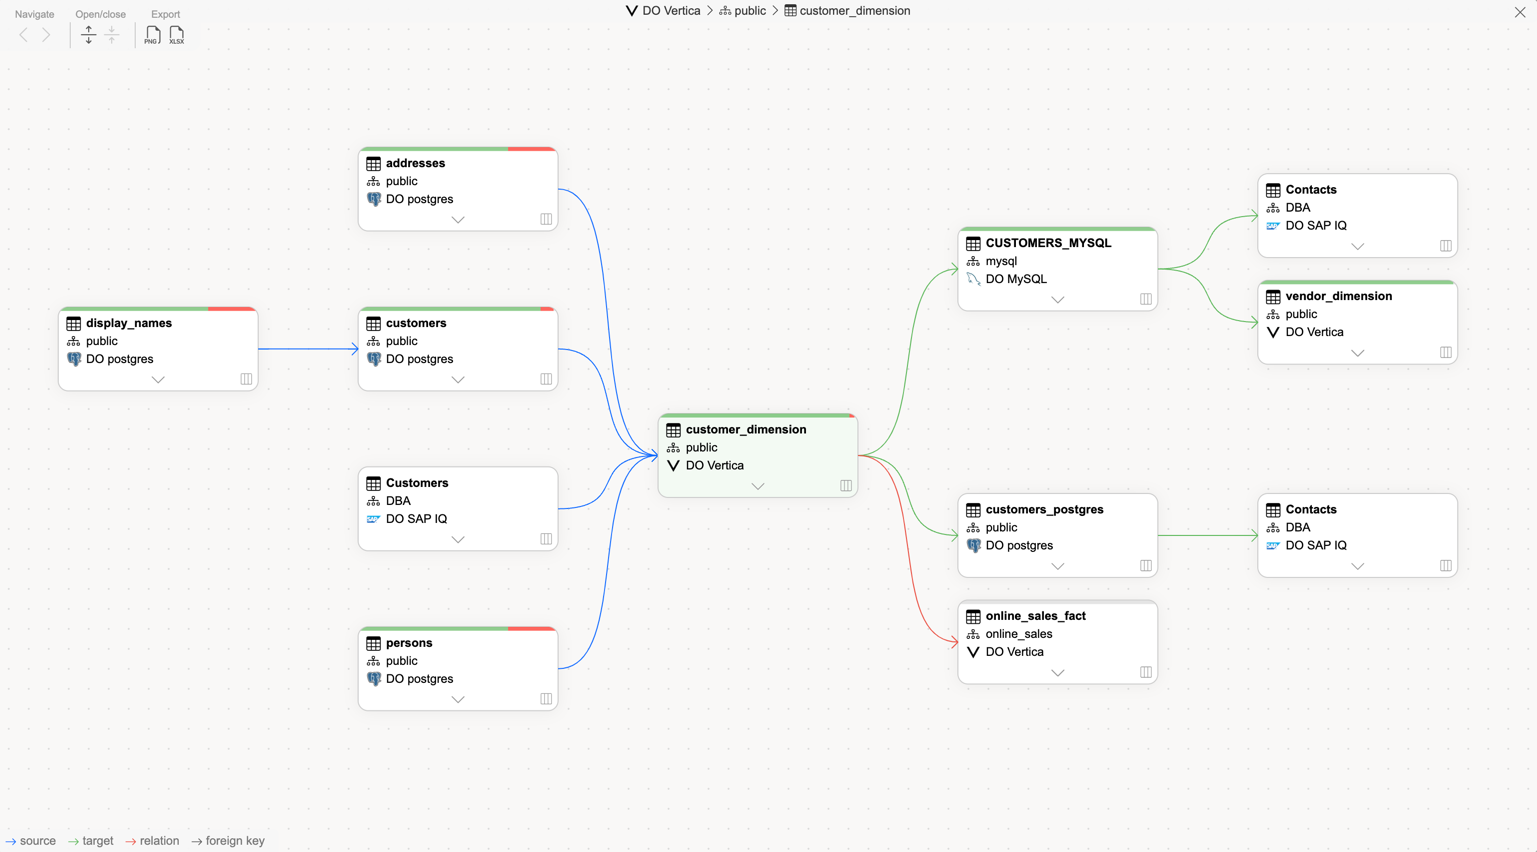
The graph highlights the full relation path of a column or edge on hover; clicking a column name pins the highlight. Clicking another table's name loads that table's lineage in place - Back and Go to root in the actions bar return to where you started.
Filtering the graph
The Filter funnel in the actions bar opens the graph's filters - the funnel turns green while any of them narrows the graph:
Type - the relation types drawn (Source, Target, Relation, Foreign Key), each listed with the arrow colour its edges use in the graph.
Connection and Schema - a selection of every connection and schema occurring in the current graph. A node that is filtered out takes everything beyond it along: its downstream subtree on the downstream side, its upstream subtree on the upstream side.
Connection and schema filtering happens on the loaded graph, so applying it is instant. Reset all filters restores the full graph; filters are not remembered, so a freshly opened lineage always starts unfiltered. The same filters are available on column level lineage.
Direct relations
By clicking on Columns chevron
 for any of the objects found on the lineage graph, a list of all active columns for selected object is displayed, with direct relations to any other columns.
By clicking on Columns detailed view icon
 a detailed view of all columns for selected object is displayed.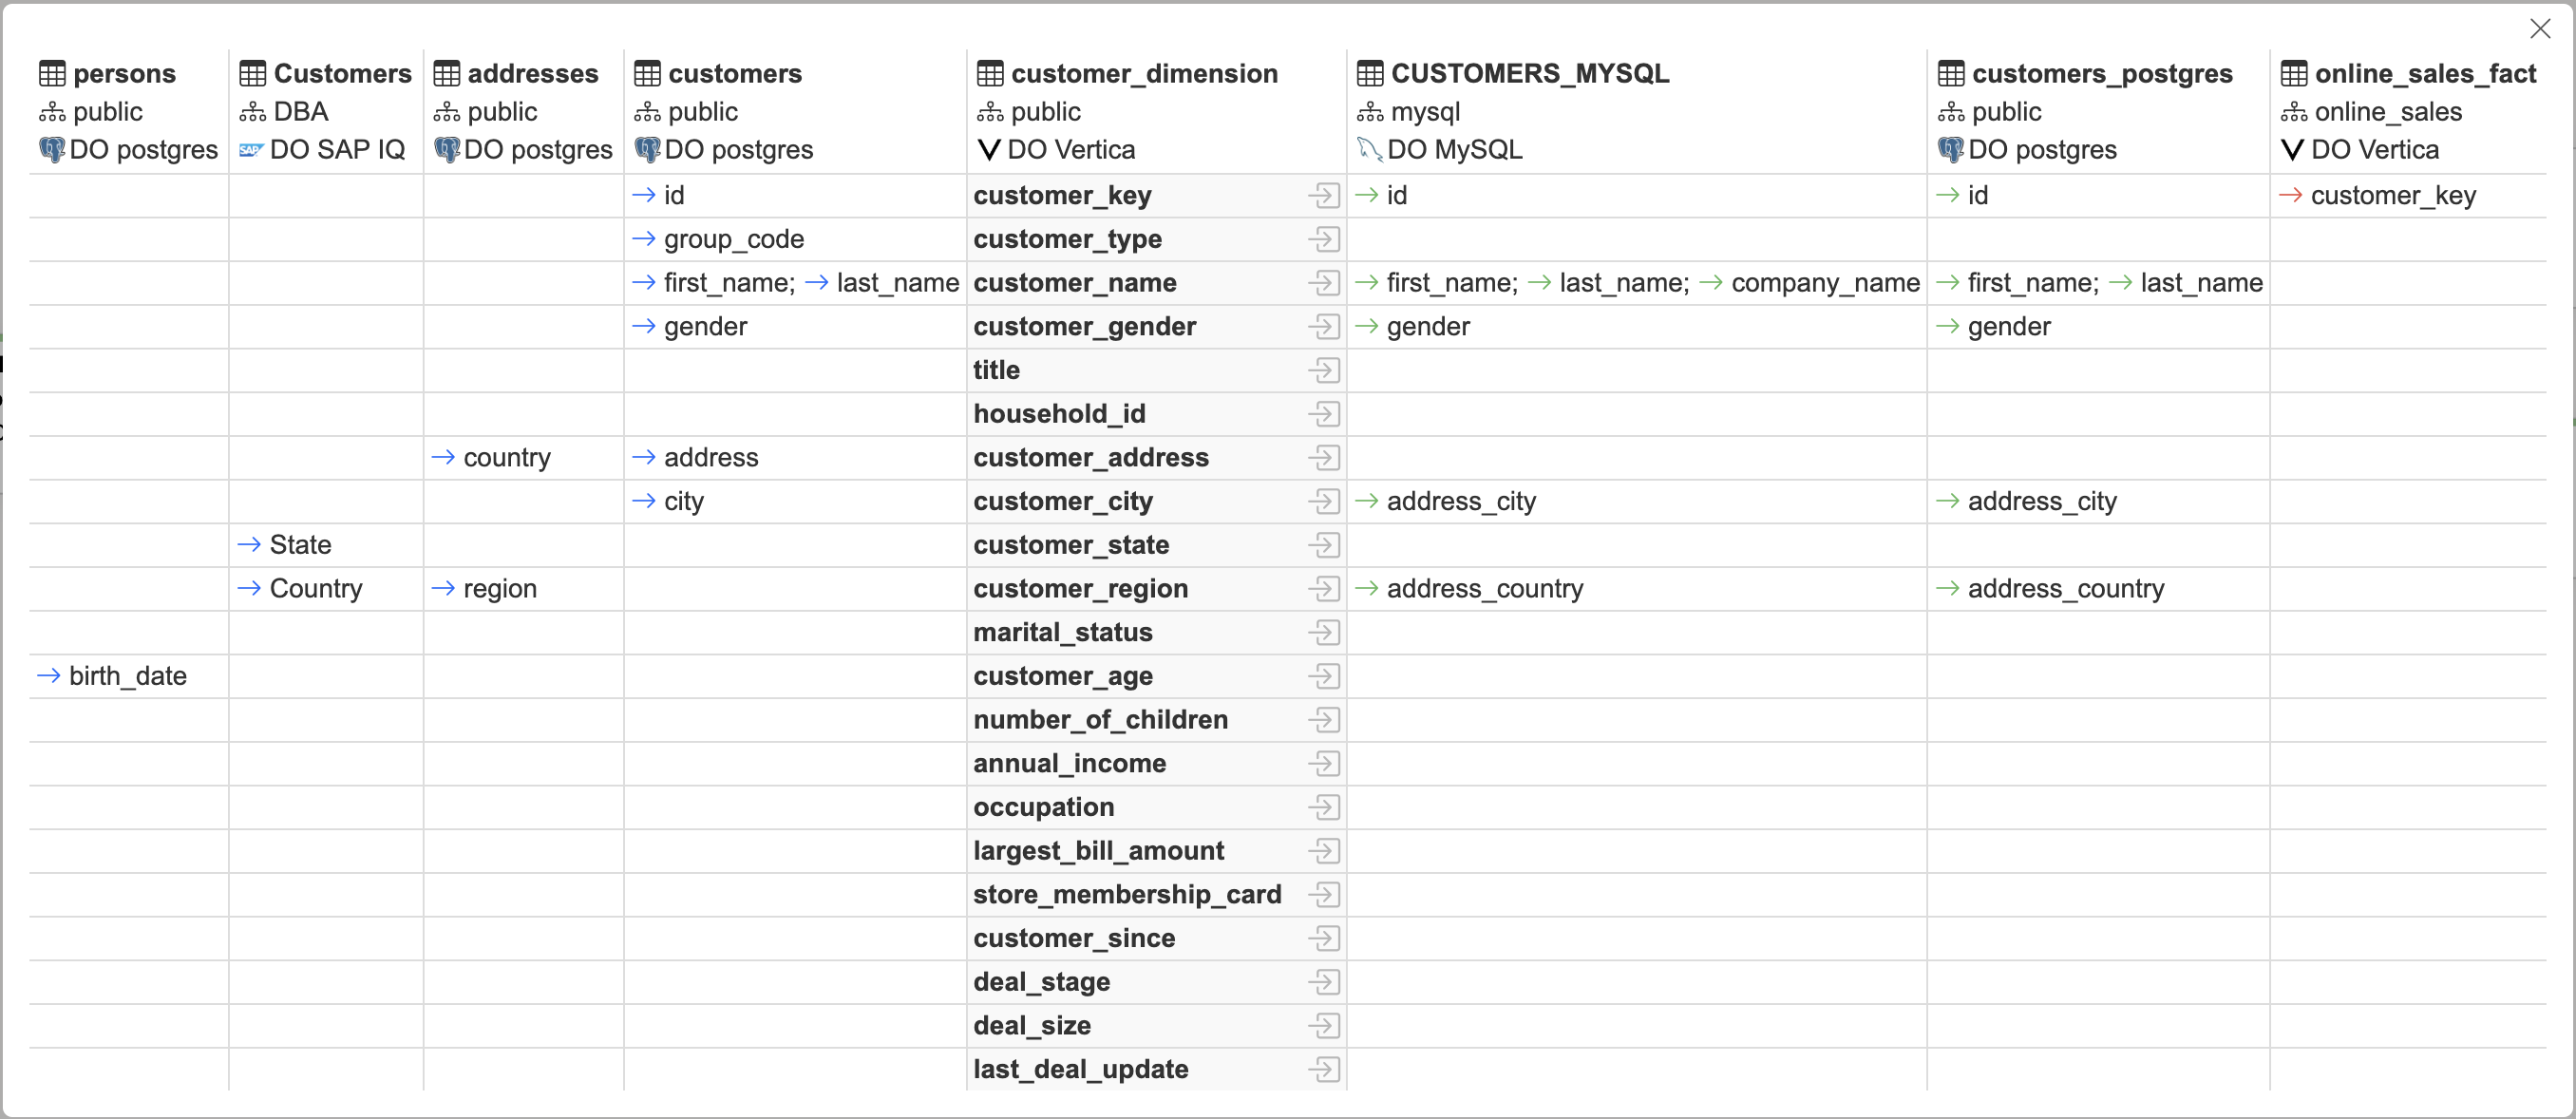
Clicking on a relation path between two objects expands the columns of both connected objects, showing the column-level relations behind the edge.
Every expanded column row has an actions menu with Add a relation (with edit privileges) and View attribute, which opens the attribute's detailed view.
Relations inside one object
A relation can link two columns of the same object - for example an average_price column calculated from lowest_price and highest_price, or two columns used together in a self join. Such a relation is never drawn as an edge between two nodes, because both of its ends live in the same table.
Instead a collapsed node carries a self-relation marker  against its right edge. Expand the node's columns and the marker gives way to the relations themselves: each one is drawn as a gray dashed bracket along that edge, from the source column's row to the target column's row. The relation-type colours describe the direction of travel between objects, which means nothing inside a single one, so the arrowhead carries the distinction instead: a bracket that ends in an arrow points at a derived column, and one without is a plain relation (columns used together in a join or a filter). The type filter still applies - unchecking Target hides the derived brackets and unchecking Relation hides the undirected ones.
Hovering either column, or the bracket itself, highlights it and fades everything else, exactly as hovering a relation between two objects does.
Column level lineage is unaffected: there both ends are ordinary column nodes, so the relation shows up as a normal edge.
dbt badge
Objects and columns matched to a dbt project display a small dbt badge in the corner of their node; clicking it opens the dbt Resources browser with the corresponding resource pre-selected.
Data quality
By clicking on data quality bar, a Data quality overview will be displayed
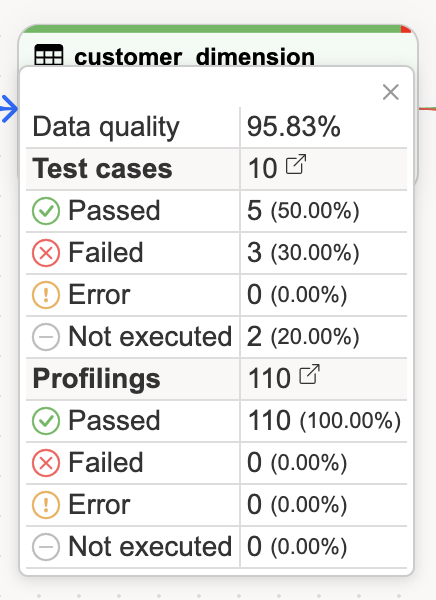
Clicking the  open-in-new-tab icon will redirect to related test cases or profilings
Viewing origin queries
In case of automated lineage you can view the query where lineage originates from by pressing on the  button on an object node or on an expanded column row. If several relations sit behind the button, a relation list opens first - click a row to see its queries.
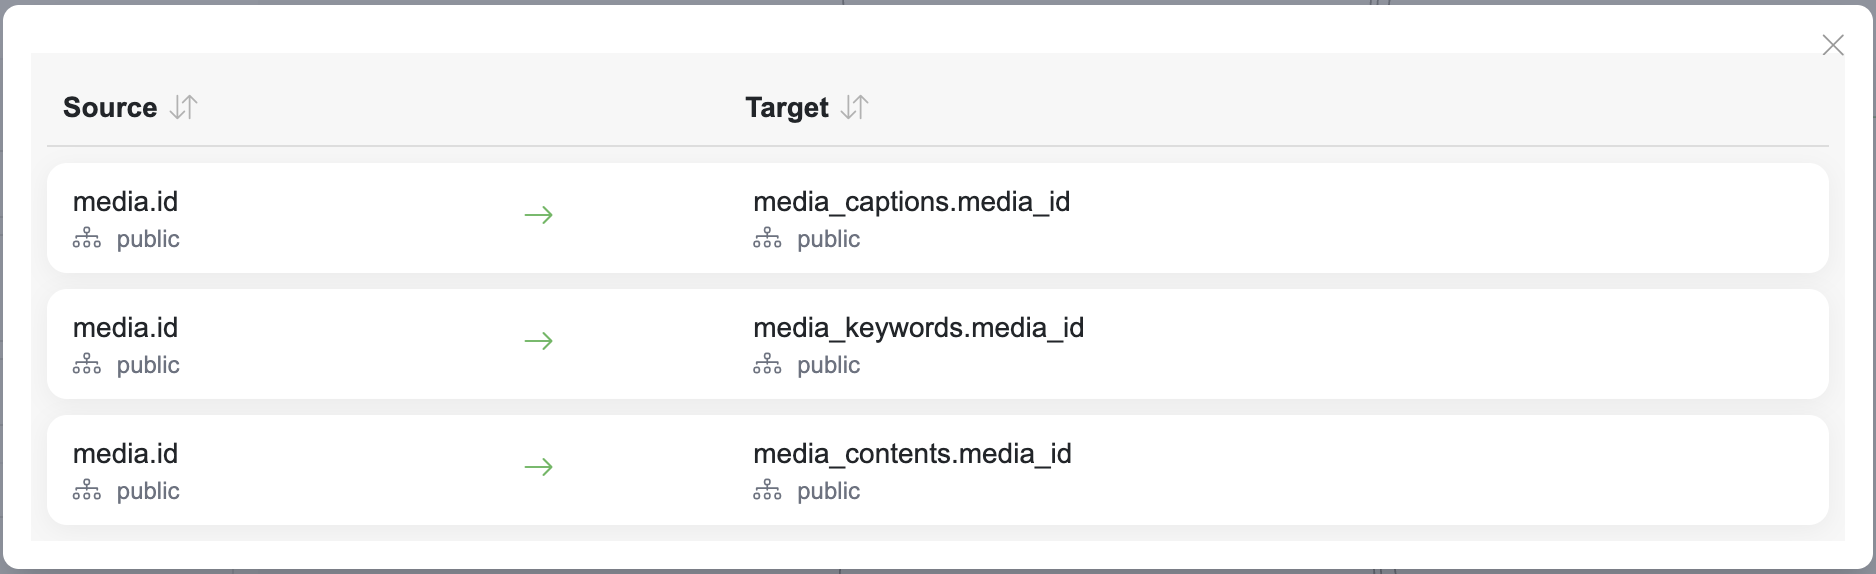
From all relations you can view detailed information about queries the relation originates from
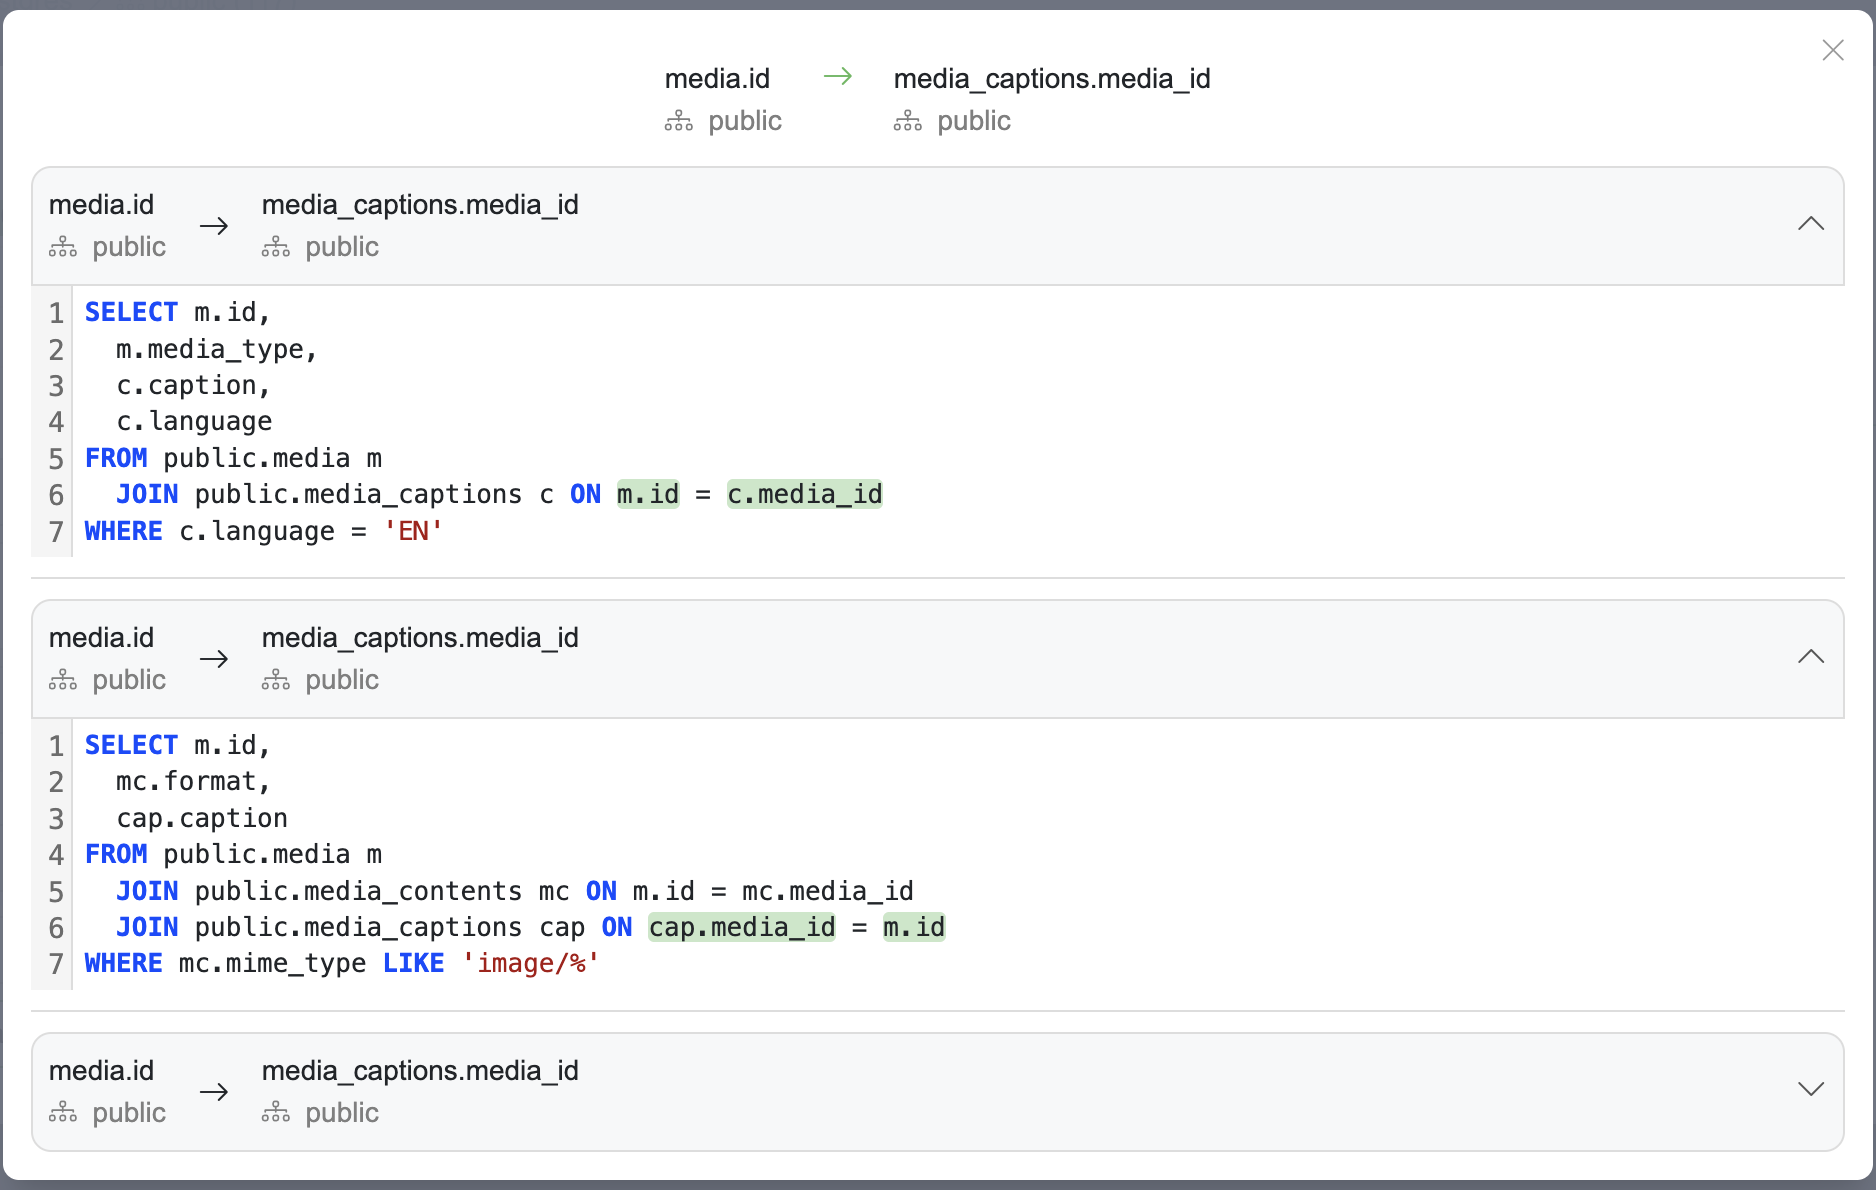
For each reference the modal shows Created by and Created at at the top of the relation summary, and each individual reference in the chain also shows its own Created at timestamp under the header. This makes it easy to tell when an automated lineage relation was first picked up and when individual contributing queries were last reimported.
Deleting a single query reference
When an automated relation has multiple contributing query references, you can remove just one of them without dropping the whole relation. Hover over a reference in the chain - a trash icon appears next to the header. Click it and confirm the prompt; the reference is removed and the relation stays in place as long as at least one other reference still backs it. If you remove the last remaining reference the relation itself is deleted.
Use this to clean up references from one-off ad-hoc queries while keeping the relation alive through your stable ETL queries.
Column level lineage
Column level lineage opens on the Lineage tab of the attribute's detailed view - via the lineage icon after the attribute's name or the tab itself. The tab is available once the attribute is part of at least one relation. From the object level graph, use a column row's actions menu (View attribute) to get to the attribute and its lineage.
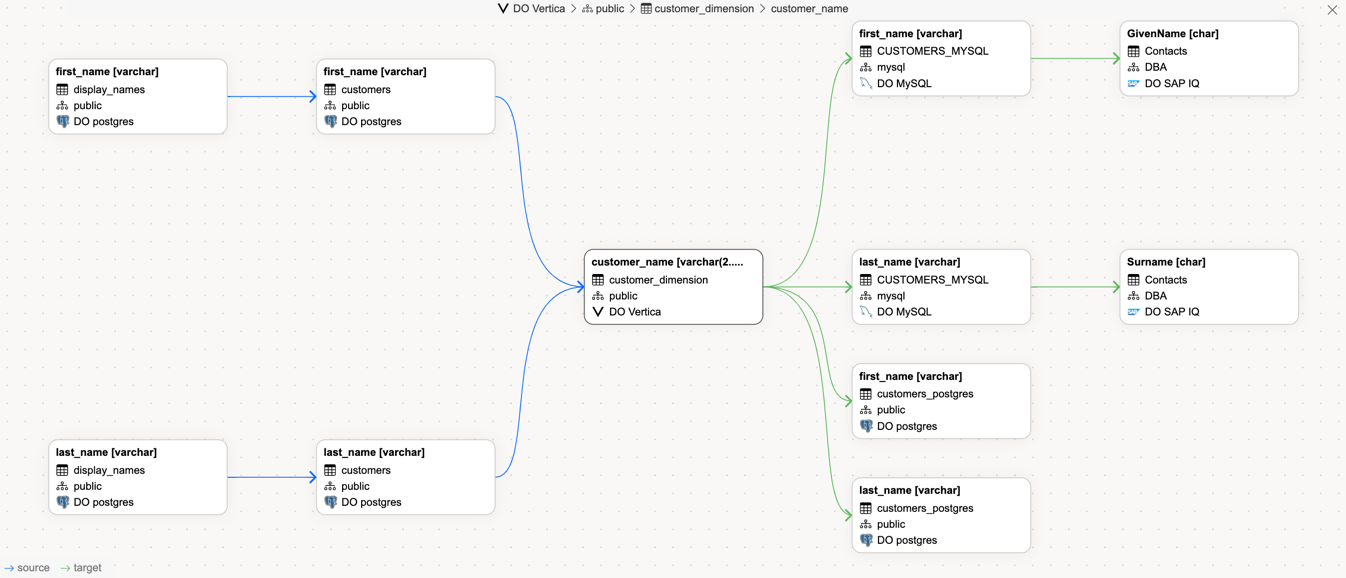
Large lineage
Lineage graphs of well-connected columns can reach tens of thousands of paths. To keep the graph readable and the browser responsive, both levels draw each column (or object) in full only once per direction:
Dashed tiles - when a column is reached again along another path, the second and later arrivals are drawn as a dashed tile without children. Click the body of a dashed tile to pan to the copy that is drawn in full.
Size limit - each direction (sources and targets) shows at most 2,500 nodes. When the walk stops short, a notice appears above the graph and the nodes that have more relations behind them carry an orange marker. Click the marker to open that node's own lineage and continue from there.
Depth limit - the graph follows at most 20 levels in each direction. The same notice and markers appear, and the notice says which limit was reached: the Excel export walks further than the size limit but shares the depth limit, so past 20 levels only opening a marked node continues.
The whole reachable lineage is available outside the graph:
Excel in the lineage toolbar's Download menu adds a Full lineage sheet with every reachable relation of the opened column or object, one row per relation with its direction and level. The graph's filters apply to this sheet too: a connection or schema you deselect is left out together with everything behind it. When the walk behind the export is cut, the sheet says so in its last row.
The object's Dependencies tab lists every upstream and downstream column with the path that leads to it. Opening the lineage from a row there expands only the objects on that row's paths; Open all expands the rest.
Open all asks for confirmation when it would draw more than 10,000 column relations, and the Dependencies tab leaves the path collapsed past that number and says so, because drawing that many freezes the browser for a few seconds.
The catalog's Attribute relations export contains all relations of the whole catalog.
Adding new relations
Open object level lineage to get options of adding new relations - the plus button in the Columns detailed view, or Add a relation in an expanded column row's actions menu
A modal lets you define the relation: select the Type (Source, Target or Related), then the target's Connection, Schema, Object and Column. The form remembers the last used target. Two columns of the same object may be related to each other - for example a total calculated from its sibling columns. Only relating a column to itself is rejected.
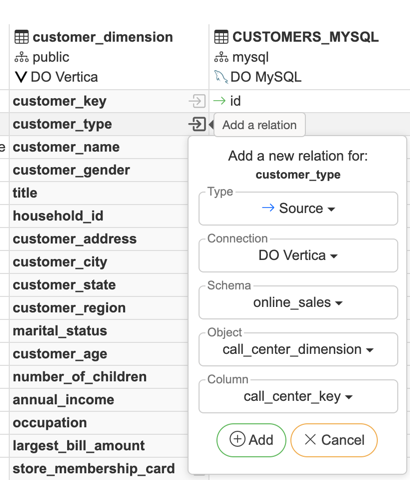
Open column level lineage to get options of adding new relations
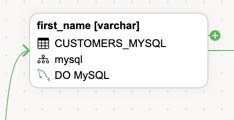
New relations can be added by hovering on any of the columns and clicking on the green Plus icon. The side of the node decides whether the new relation is a source or a target.
Deleting a relation
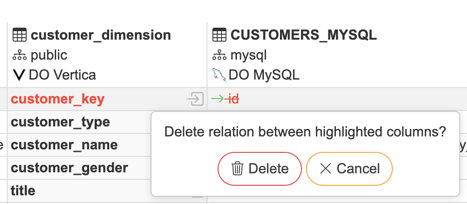
Open the Columns detailed view from the object node's list icon, then click the arrow-and-attribute link on the row whose relation you want to remove. A confirmation modal asks Delete relation between highlighted attributes? before anything is removed.
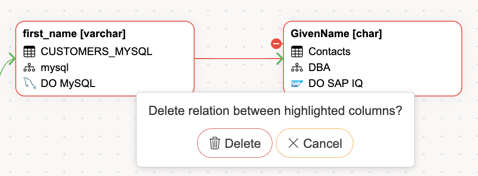
To remove a relation between columns, hover on the column and click the red minus icon. Clicking on it will open a confirmation modal for deletion.
Lineage actions

Navigate - Back and Forward through the graphs already visited, Go to root to return to the opened object, and Maximize to expand the embedded graph (which then offers Restore).
Open/close - Open all objects and Close all objects expand or collapse all column relations (object level only).
Export - Download opens a menu with PNG, SVG and Excel. The workbook has two sheets: Data, the direct relations of the opened column or object, and Full lineage, every reachable relation (see Large lineage).
Pick SVG when a tall graph comes out blurry as PNG: a PNG is capped at 32,767 pixels per side, so a very tall graph is shrunk to fit, while an SVG stays sharp at any size
Open the SVG in a browser: office and drawing tools (Word, PowerPoint, Visio, Inkscape) show the object names but not the column rows
Mass actions
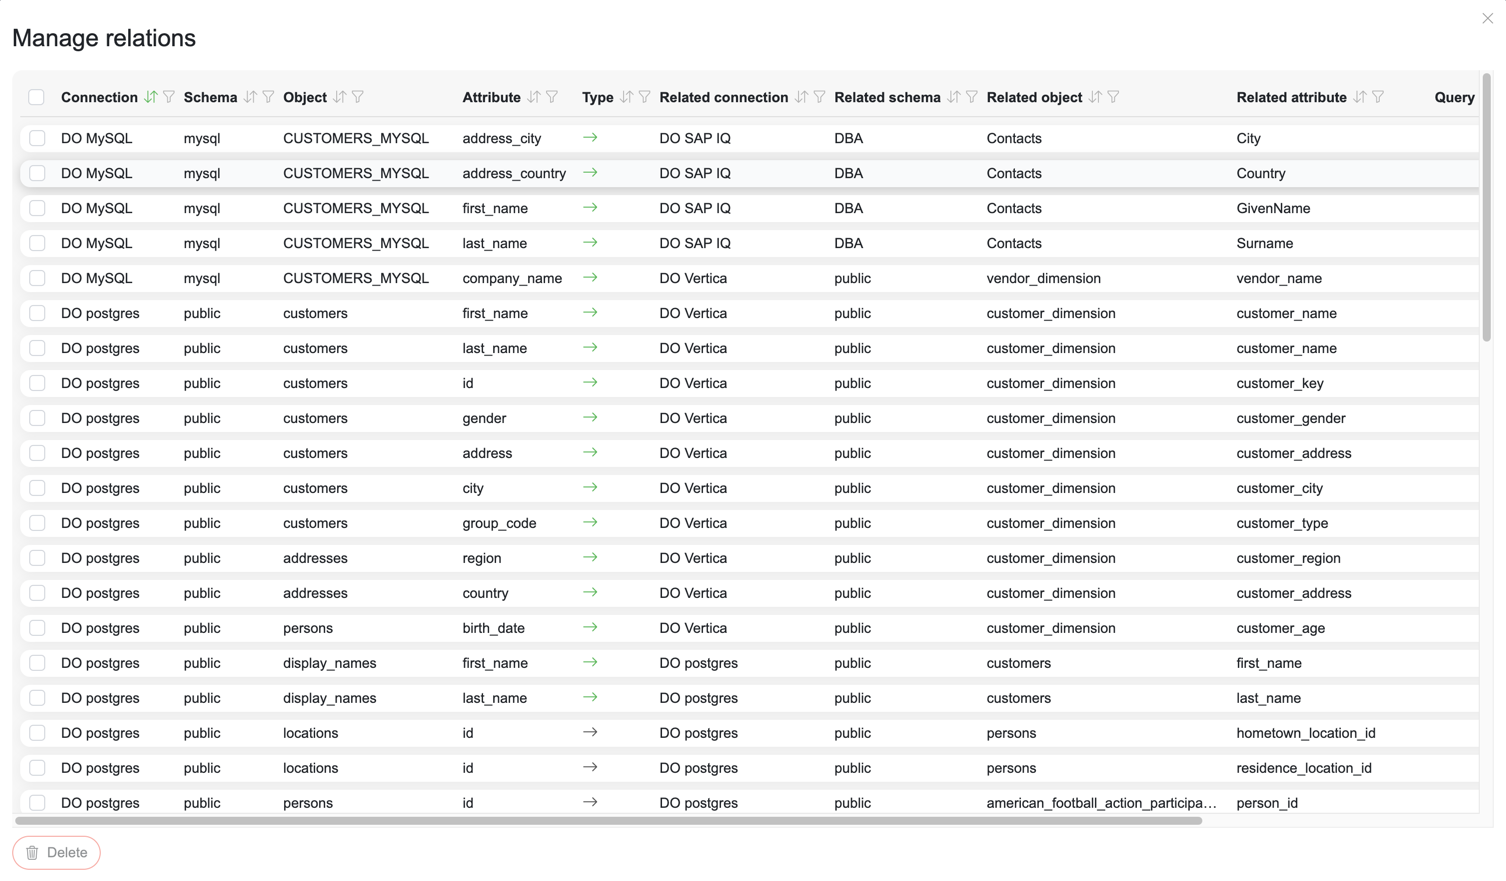
The Manage relations option is found in the "More" dropdown on the right of the toolbar on the Objects and Attributes tabs.
Manage relations view allows you to manage all lineage relations between catalog objects in a single view - with per-column filters, configurable columns, a Queries column opening the origin queries, and visibility into creator, creation date and origin. Relations can be selected and deleted in bulk.
Relation origin tracking
The manage relations view includes two columns for tracking where relations originate from:
Origin Type - how the relation was created: Manual, Auto or Import
Origin - provides the specific source reference, such as the import file name or an UUID identifier for relation batch
For file-based imports, the origin is automatically set to the import file name. For automated lineage, the origin references the source query.