Profiling
Profiling page allows users to set profiling rules for selected objects and columns. This allows users to get insights on what kind of data is available, how the data is changing over time, and detect anomalies and deviations in data.
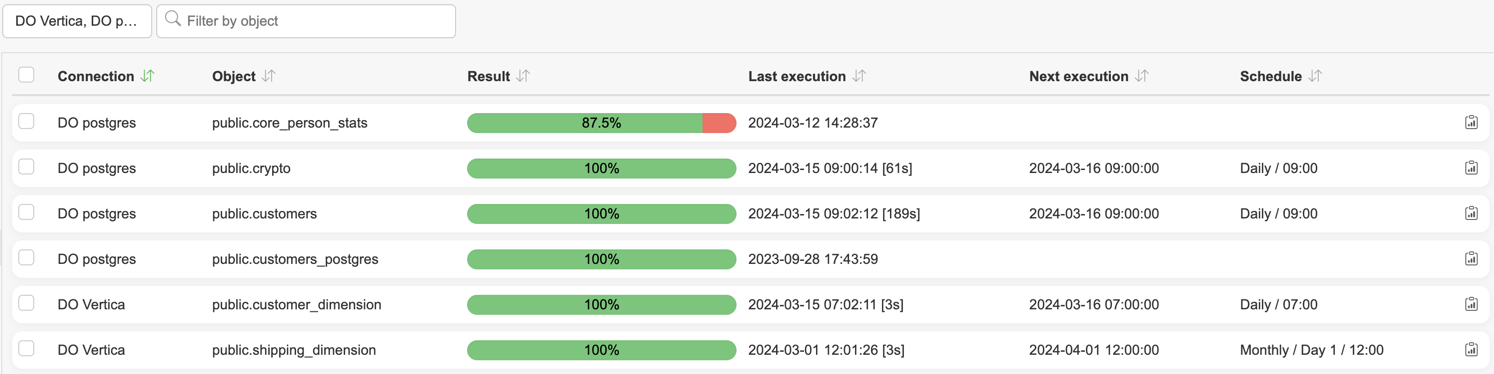
The list columns are Result, Connection, Schema, Object, Name, Last execution, Duration, Next execution and Schedule. Most columns can be sorted and filtered, the visible columns can be customized from the table settings, and applied filters can be cleared in one click, restored from the filter history, or shared with other users via a copied link. A free-text Search box in the toolbar matches the connection, schema and object name from three characters onwards.
Adding a new object to profile
Press "Add objects" button in the toolbar
Narrow the candidate list with the free-text search or the Connection, Schema and Table column filters. The Existing profilings column counts the profilings that already cover a table, and its info icon lists them by name
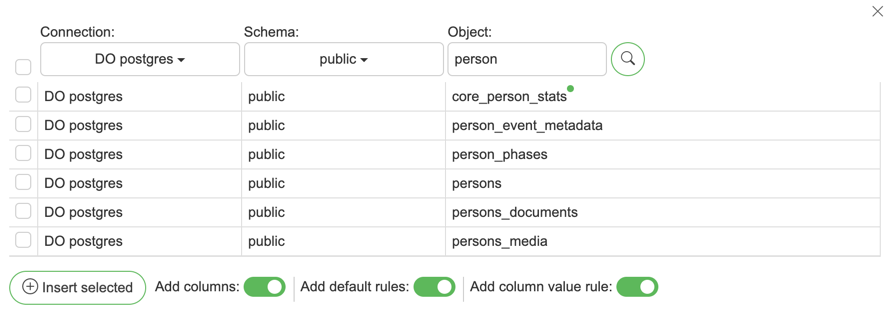
Choose objects to profile by checking checkboxes and clicking the "Add" button. The selection survives paging, sorting and filtering, so candidates can be gathered across several filters before adding them
New profiling object will now be shown on the page
Modifying profiling object
Clicking a profiling object opens its detailed view. The sidebar shows the object's data quality (current split and history trend), the Row count and Freshness checks, and its settings; the main area shows the profiled columns with their rules, results and executions. From the detailed view's header the user can copy a direct link, subscribe to alerts and set the schedule. Opening a profiling object allows to:
Schedule rules to run
Subscribe to alerts for this profiling object - profiling participates in the unified alert scopes model (Failure alert). Recipients are managed per user, either from the user's own My alerts tab or centrally by an admin in Alerts settings → Managing user alerts.
Set the Threshold for anomaly detection: Auto, Auto + minimum or Manual with a percentage band
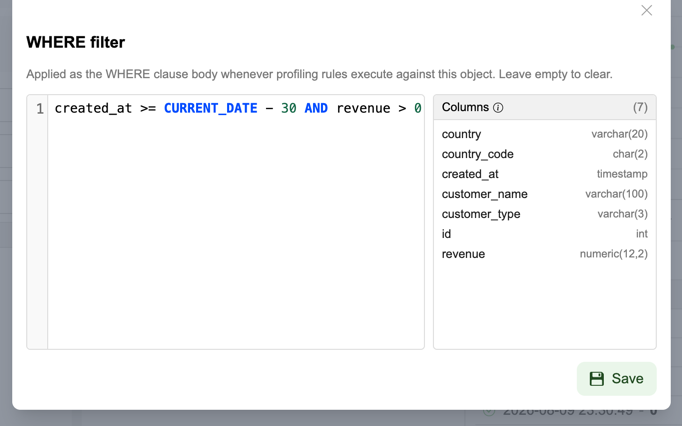
Set a Filter limiting the profiled rows: None (the default), Date or Manual (SQL). Date takes a date column and a range of Today, Today and earlier or Last N days, and its Filter SQL line expands to show the generated WHERE body read-only. Manual (SQL) opens the WHERE filter editor, which pairs a SQL editor with the object's Columns list: click a column to copy its name, or drag it into the editor. Leaving the editor empty clears the filter
Execute rules manually
Add/remove rules for a column
Delete object/remove profiling for an object
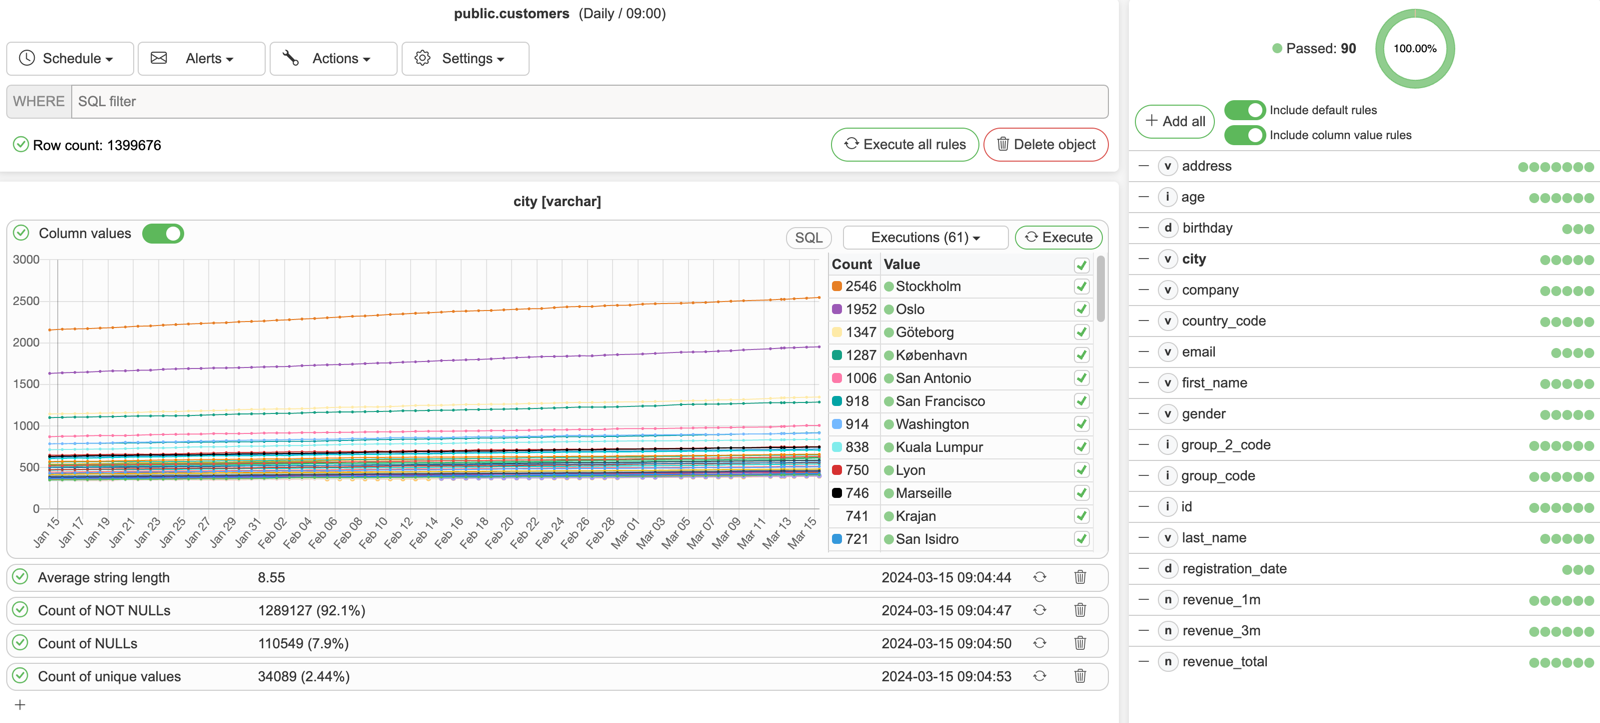
The Actions menu below the settings additionally offers Execute all rules, Backfill profilings, Test case suggestions, Get report (a downloadable HTML profiling report) and Add rules (default rules for every column without any).
Row count and Freshness checks
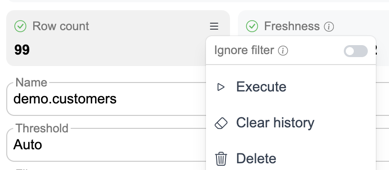
The sidebar's Row count and Freshness cards track the object's size and how recent its data is. Each card shows the check's status and latest value; clicking it opens the full history chart. New checks are added with the Row count/Freshness buttons (freshness needs a date column), and each card's menu allows executing the check, clearing its history or deleting it.
The row count check has an Ignore filter toggle. While it is on, the check counts the whole table instead of only the rows the object's Filter admits. The toggle is only offered when the object actually has a filter set.
Backfill profilings
Actions → Backfill profilings re-runs the object's rules for past days using a timestamp column, seeding history and anomaly detection with real past data instead of waiting for daily executions. Individual rules can be opted out of the backfill. When rules exist but nothing has executed yet, the object view offers the backfill proactively.
Deleting a profiling object
Open profiling object and click the "Delete" button below its settings

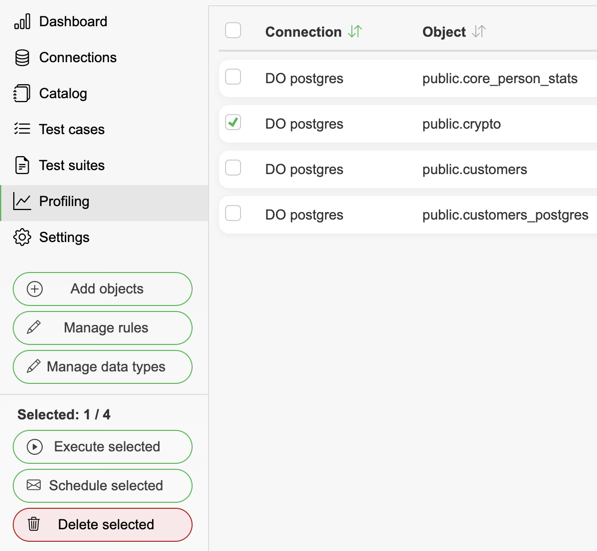
Or select object(s) from the list with the checkboxes and click the "Delete" bulk action
Bulk actions
Selecting objects in the list with the checkboxes (or the header select-all) replaces the toolbar buttons with bulk actions: Execute, Delete, and a menu for setting the Schedule, Threshold or Filter of all selected objects at once.
Column values
It is possible to analyze how values in column change over time. This allows the application to detect deviations/anomalies in date and alert users.
The column values view shows the value counts over time, a distribution chart for the latest execution, and the value table. Clicking a value focuses the chart on it, including its forecast and threshold band. The distribution chart's Include other toggle folds the values outside the chart into a single Other slice, and selecting a past execution pins the view to it, marked Showing execution with a Back to latest button.
The range picker above the history chart offers 7, 14 and 30 days or All, defaulting to 30. The choice is remembered in the browser and shared by every profiling history chart, so changing it in one place carries over to the rest.
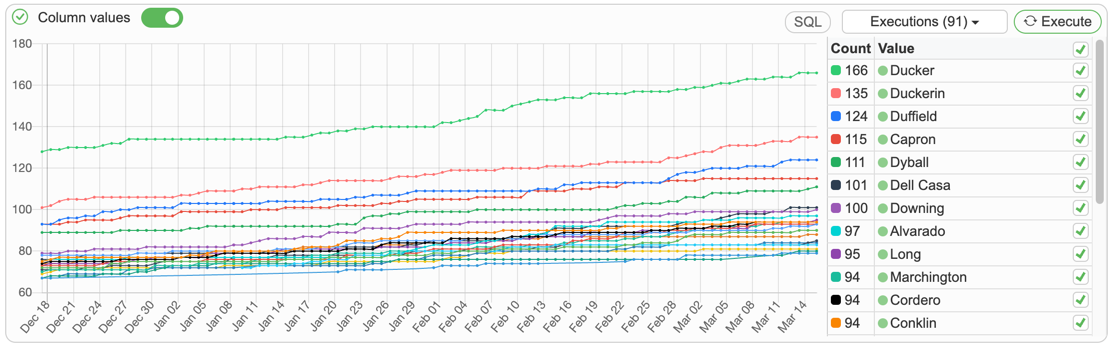
By default, column values are analyzed by finding counts for each value. It is possible to change the SQL used to get column value results by clicking “SQL” button:
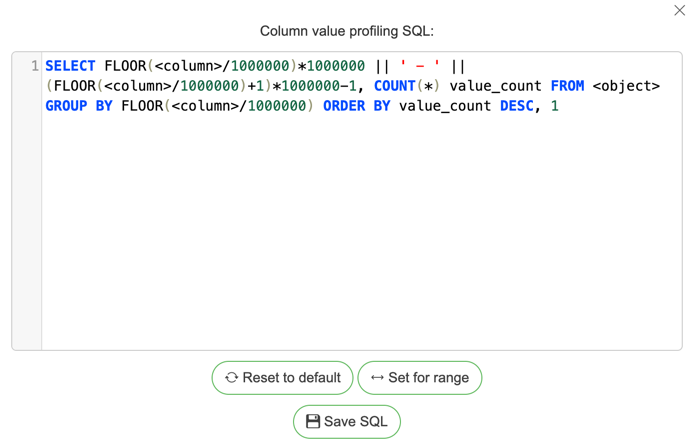
The Template selector offers Default (value counts), Numeric ranges (grouped into ranges of the given Range size) and Starts with (prefix) (grouped by the first Prefix length characters). A custom query must return a value and its row count; <column> and <object> are replaced with the profiled column and table at execution.
Delete values from column value history
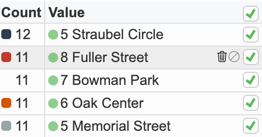
You can delete values that no longer exist in column by clicking the trashcan icon for a value:
Exclude values from column value history
Excluded value results are still saved, but are no longer analyzed for anomalies (excluded values do not flag as failed). You can exclude values by clicking the exclude icon for a value:
Managing executions in column value history
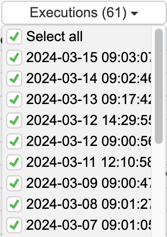
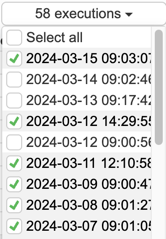
To manage past executions, open the execution history list and click the pencil (Edit executions). Select executions with the checkboxes and Disable (excluded from analysis), Enable or Delete them:
Profiling rules
Profiling rules are used to profile data for columns. By default, a set of rules is available by the application, such as:
Average numeric value
Count of NULLs
Count of NOT NULLs
Count of unique values
SUM of values
Maximum/Minimum numeric value
Maximum/Minimum/Average string length
Each rule in the column's rule list shows its status, last result and a sparkline of recent runs.
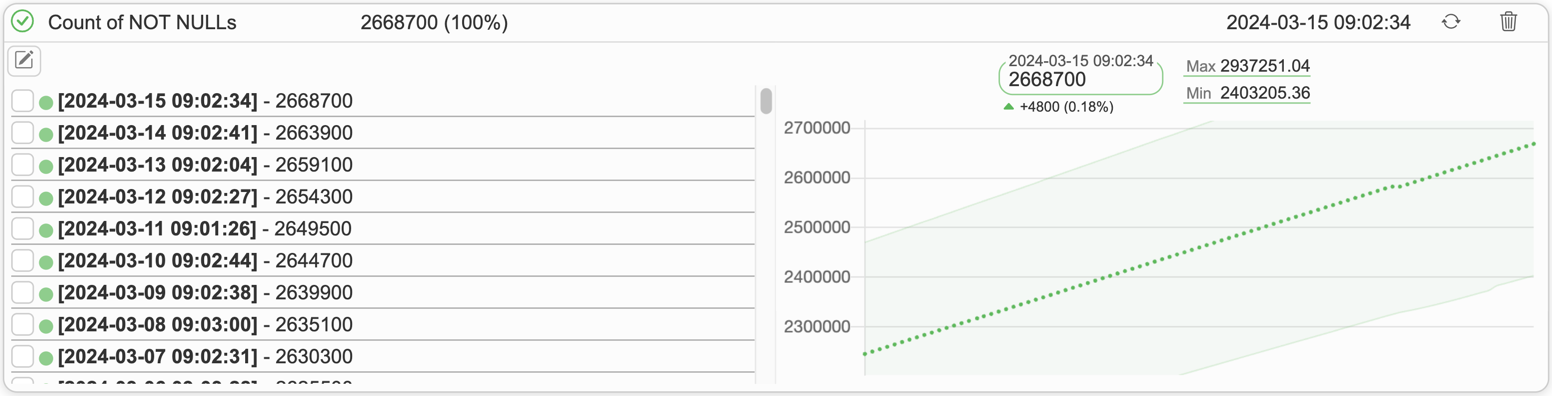
The Profiling rules panel header carries the total rule count and a chevron that expands or collapses every column at once.
Acting on several rules at once
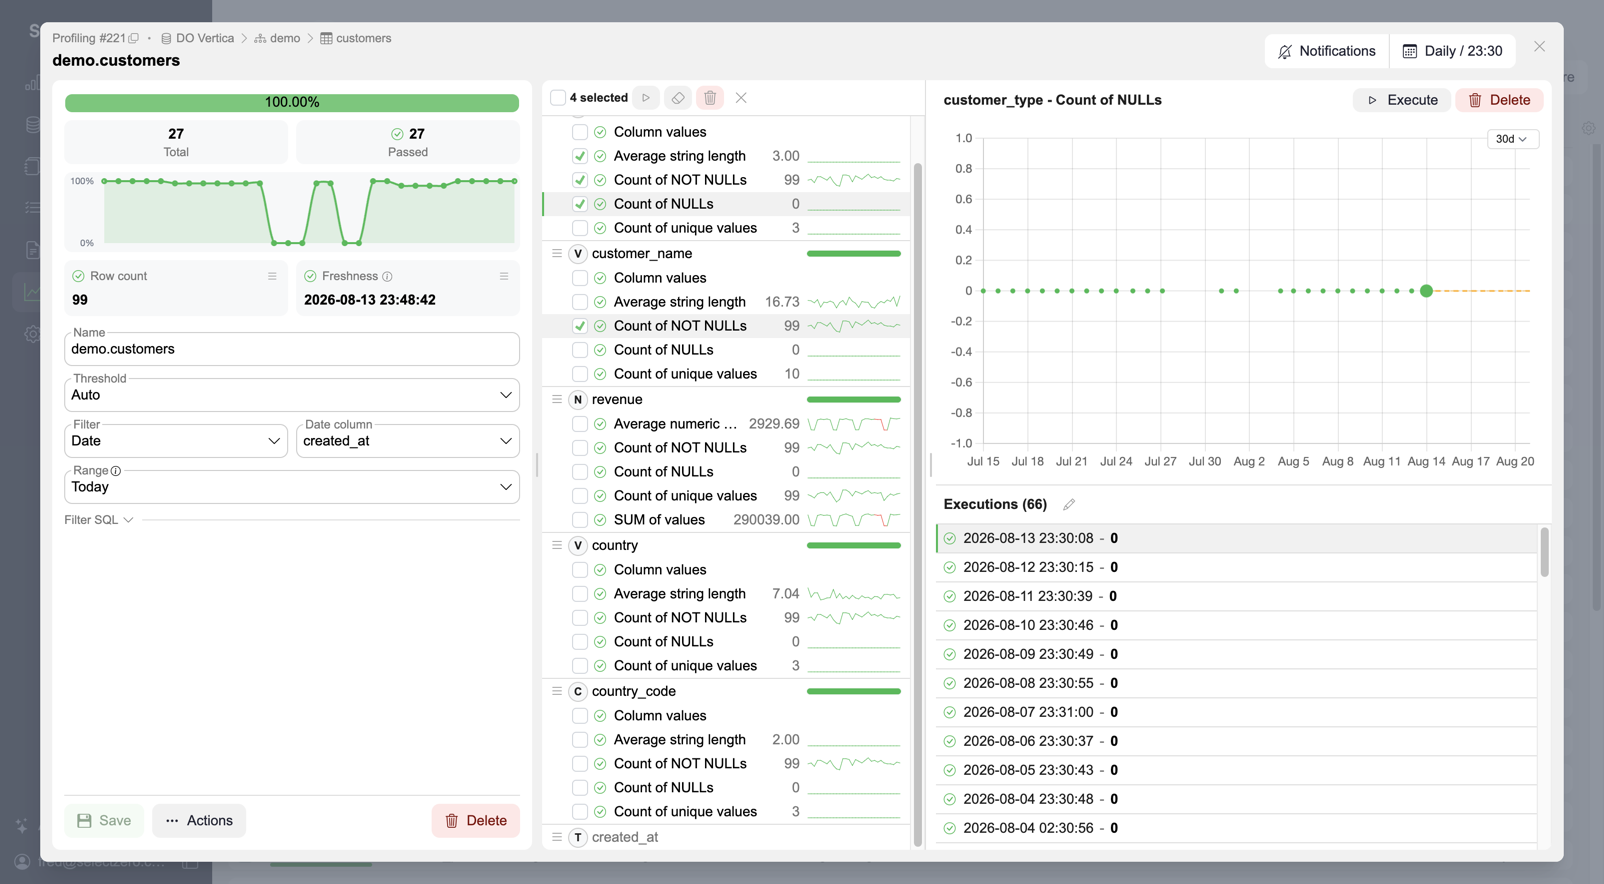
The pencil in the Profiling rules panel header switches the list into selection mode, where rules can be picked across different columns and then executed, cleared or deleted together:
Execute selected runs the chosen rules
Clear history discards their execution history but keeps the rules
Delete selected removes the rules and their history
Selection mode is left with the X. Execute selected is not shown without the execute privilege.
The column menu
The actions a column's menu offers depend on whether it already has rules:
A column with rules offers Add a rule, Execute column profilings, Clear history (discards the execution history of every rule on that column, keeping the rules) and Delete rules
A column without rules offers Add a rule and Add default rules
Add default rules, Clear history and Delete rules ask for confirmation first; Execute column profilings runs straight away. Without Add/edit profiling objects the menu is limited to Execute column profilings.
Adding profiling rules to a column
There are 4 ways to add rules to a column:
Automatically when adding new profiling objects, via the Add default rules and Add column-value rules toggles
Via the column's menu → Add default rules (offered when the column has no rules yet)
Via the column's menu → Add a rule - a dialog for picking any applicable rule from the library
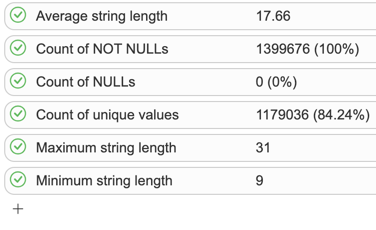
Via Actions → Add rules, which adds default rules to every column without any
Removing profiling rules from a column
Profiling rules are removed/deleted when:
Selecting Delete rules from the column's menu - removes all rules and history of that column

Deleting a single rule with the Delete button in the rule's header, which also removes its execution history:

Executing profiling rules
To execute a single rule, open the rule and click Execute in its header: 
A whole column executes via the column's menu → Execute column profilings, and the whole object via Actions → Execute all rules.
Managing rule executions
To disable, enable or delete executions from rule history, click the pencil (Edit executions) in the history list, select executions and apply the action. A failed execution can also be marked as expected - its status flips to passed (marked with *) and the acceptance can be reverted later: 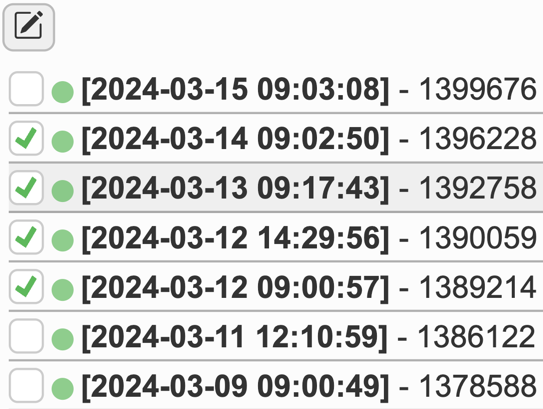
Manage profiling rules
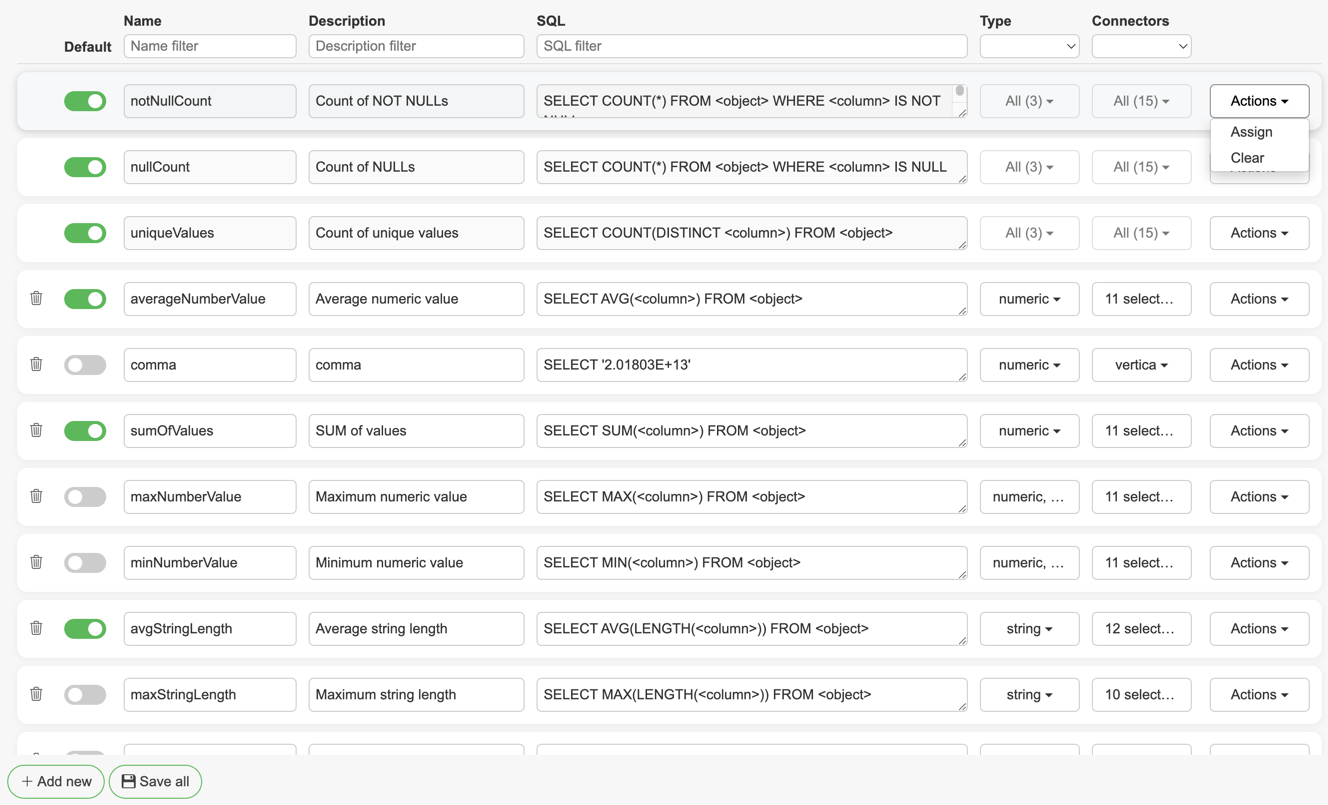
Profiling rules can be added/removed/changed via the "More" → Manage rules option in the toolbar. The More menu holds only the two manage screens, so it is not shown at all to users without the Add/edit profiling rules privilege. Each rule can be assigned for specific database drivers/connectors and data types. A rule must have a unique name. Parameters available to use:
<column> – column name
<object> – table/view name with schema (schema.table)
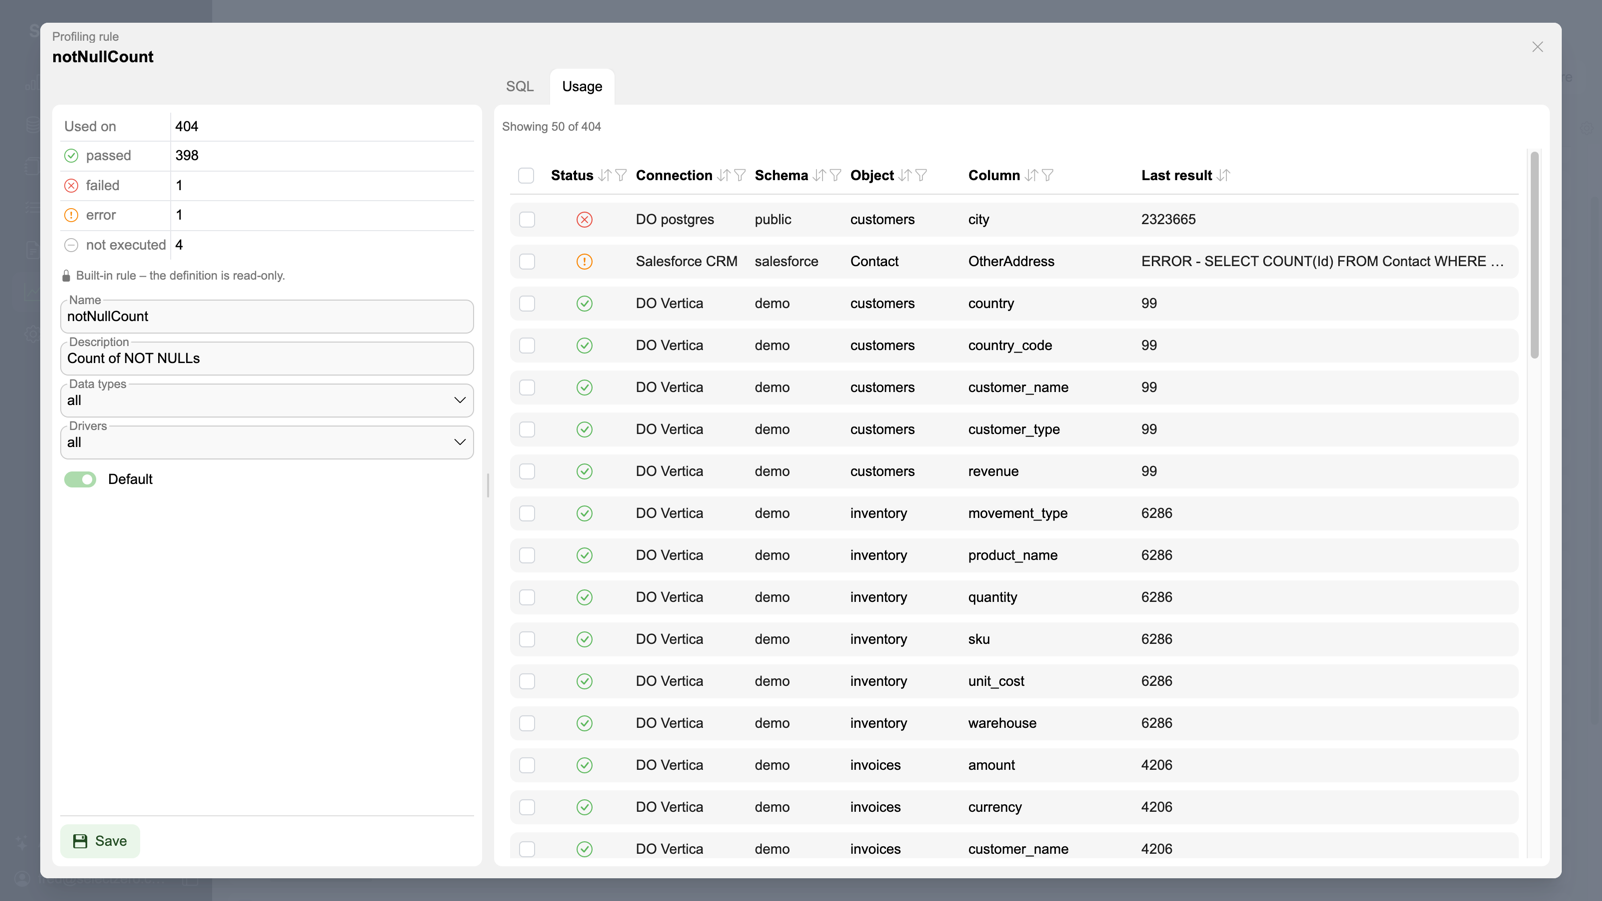
A rule's detail has a SQL tab and a Usage tab. Usage counts how many columns the rule is used on and how they last resolved (passed, failed, error, not executed), and lists every one of them across all objects. Selecting rows there offers Execute, Unassign and Clear history. Built-in rules are read-only, which the detail states above the definition.
Rules with "default" value turned off are not automatically created when generating rules for an object/column. They can only be added manually.
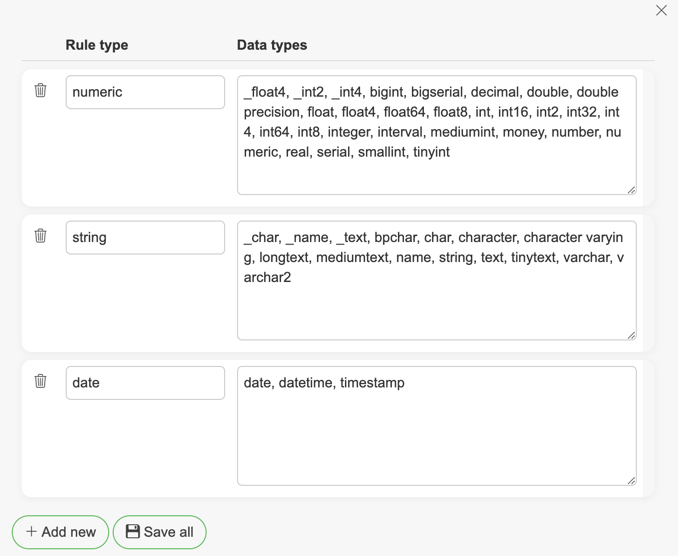
Manage data types
Data types for rules can be added/removed/changed via the "More" → Manage data types option in the toolbar. Rule types categorize which rule can be created/assigned for a column based on its data type. Each entry pairs a Category with its Native types (comma-separated), and new ones are added with Add type. Data types with parentheses must be inserted without the parentheses (e.g. VARCHAR(150) as VARCHAR). Each data type's detail also shows which rules target it. Deleting a data type unassigns it from every rule that uses it.