Alerts settings
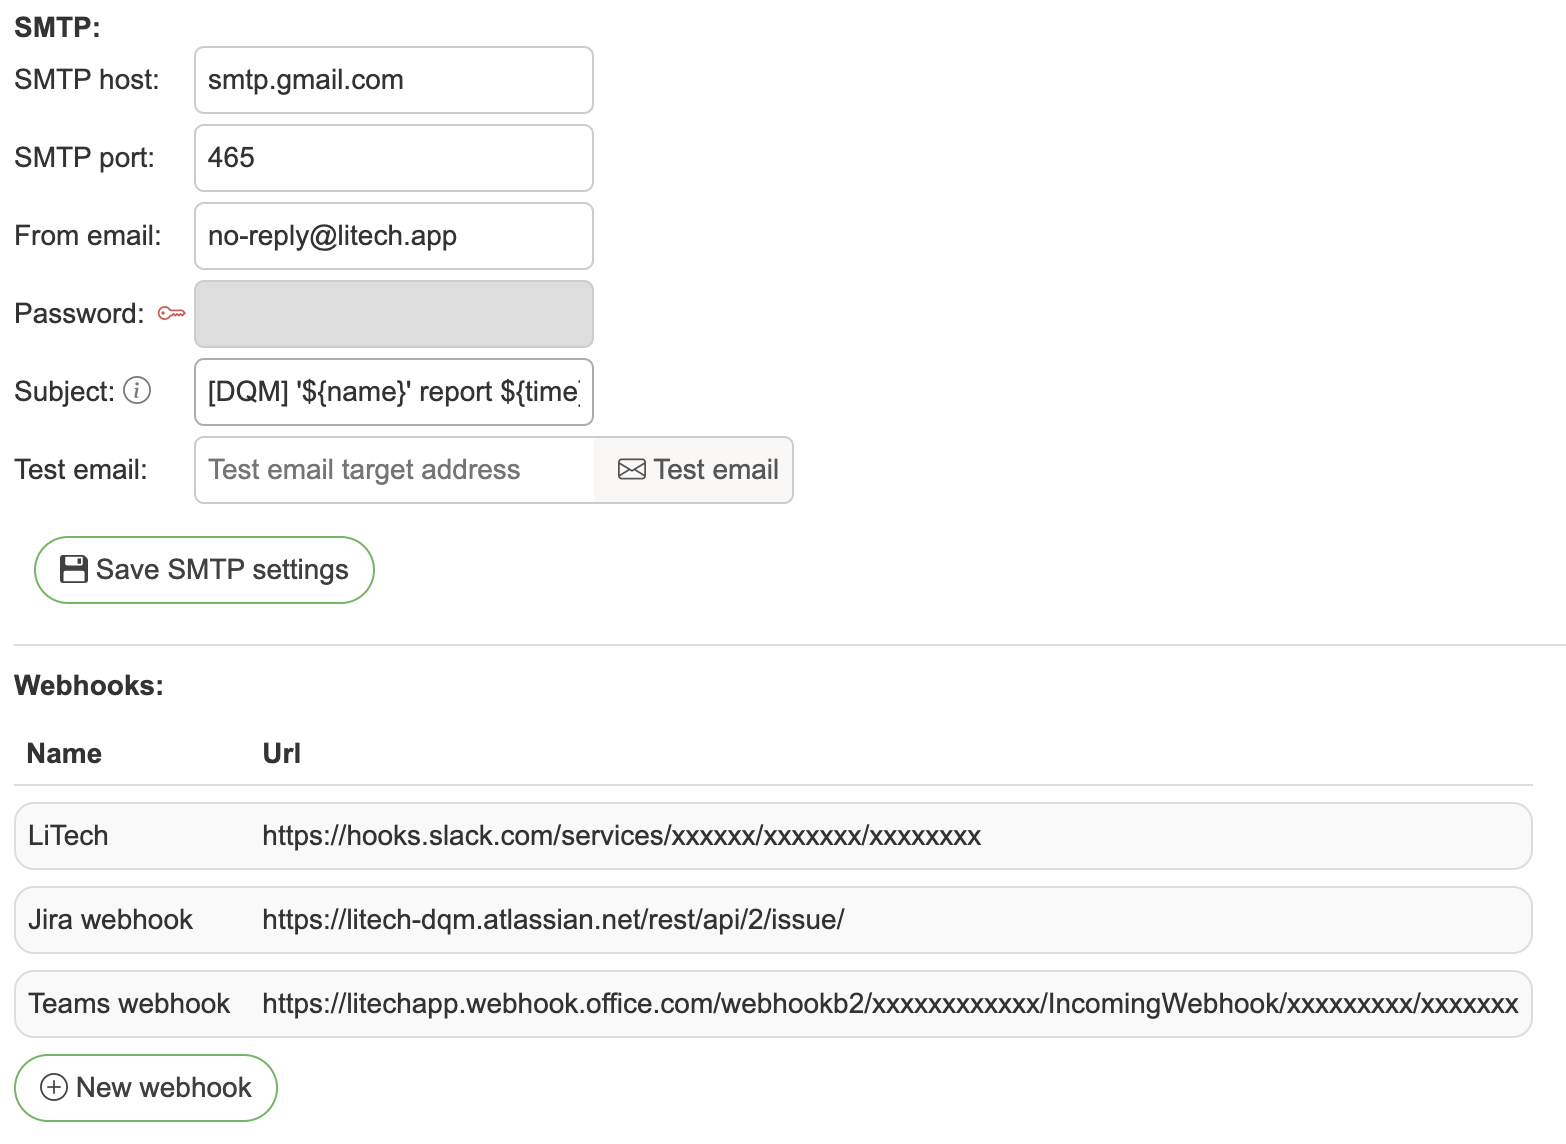
The Alerts tab has three sub-tabs:
SMTP - outbound email server configuration, with the user alerts management section beneath it (not shown on cloud deployments)
Webhooks - outbound webhook destinations (requires a valid license)
Event log - the delivery log for both channels
SMTP settings:
SMTP host – host of your email server
SMTP port – port of your email server
Security – encryption mode for the connection: None (no encryption), STARTTLS (port 587, upgrade to TLS), or SSL/TLS (port 465, implicit SSL)
SMTP user – (optional) SMTP authentication username. If left empty, the from email is used. Required for services like AWS SES where the SMTP username differs from the sender address
Password – password for email if authentication is needed
From email – email that will send out reports
Subject – email subject title
Test email / Send test email – send a test message to verify the configuration
Webhooks:
Name - Webhook name
Url - Webhook URL
Adding webhooks
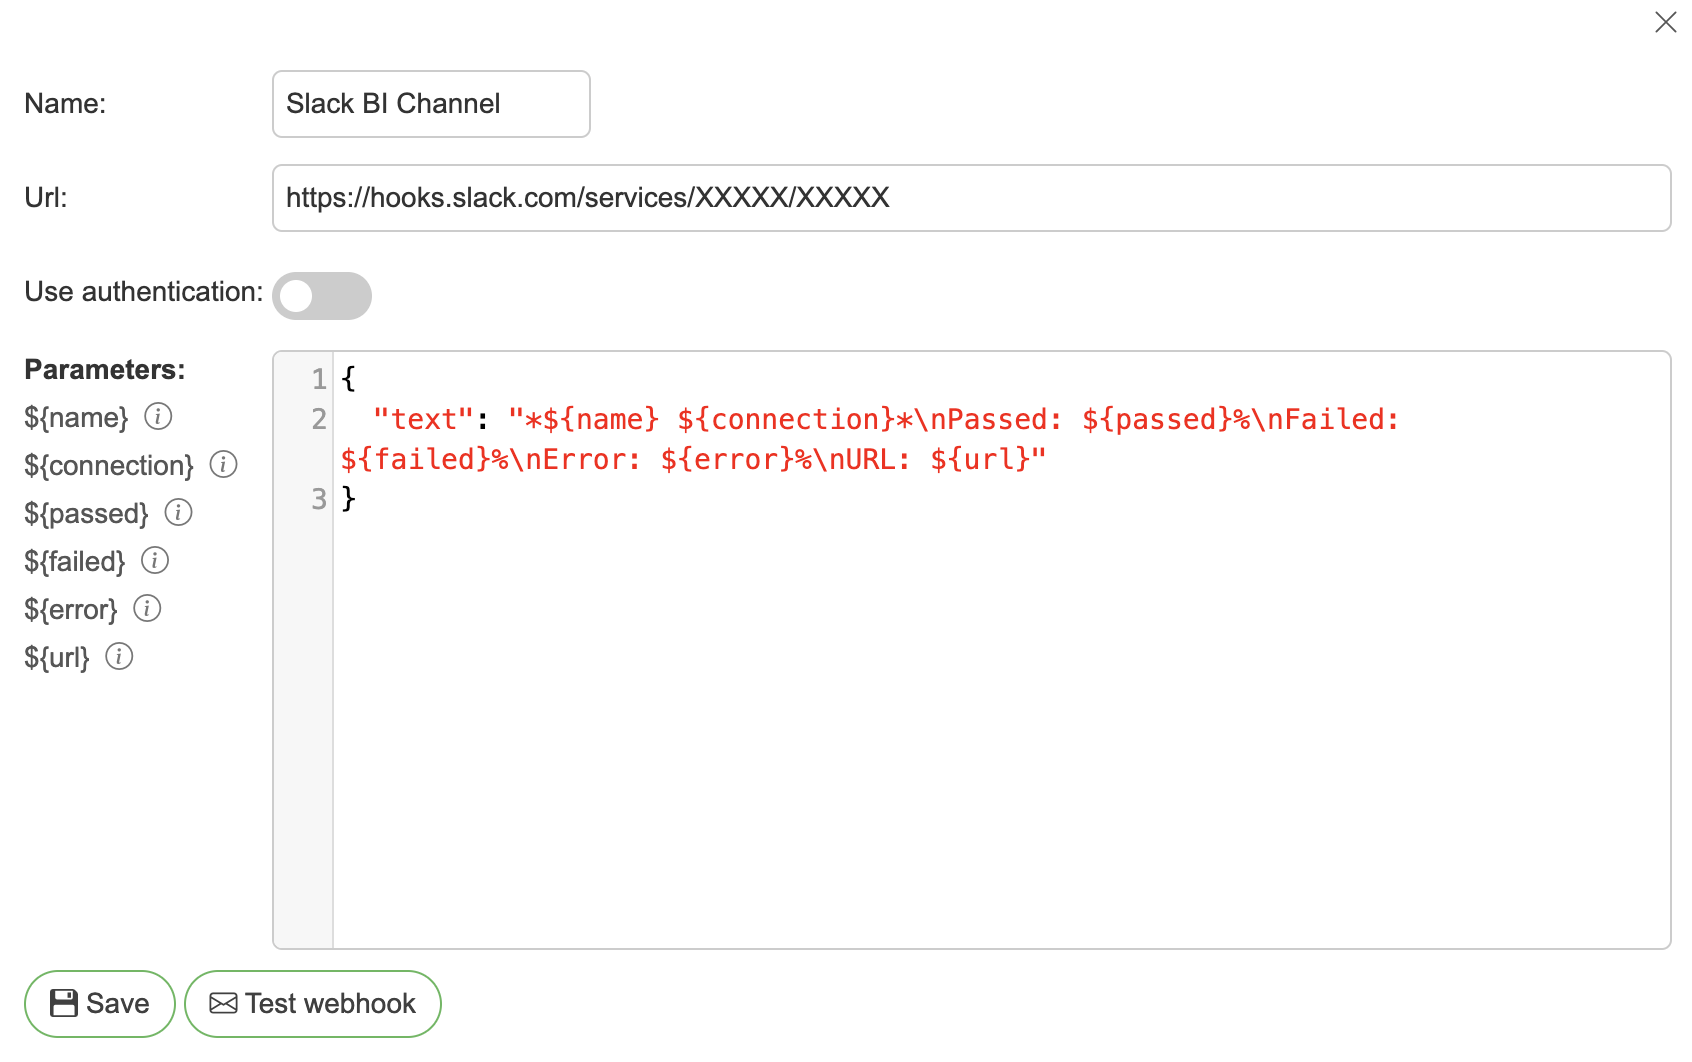
Name – Webhook identifier name
Url – Webhook URL
Authentication – None, Basic Auth (username + password) or Custom header (header name + value)
Body – JSON body for the webhook, which will be executed with POST request.
The webhook editor shows the available placeholders in a panel on the right, grouped by when they resolve - click any placeholder to copy it to clipboard, or drag it straight into the body. The Event type selector above the panel switches the panel, the live Preview below the editor, and the Test webhook button to that event type, so you can check how the same template renders for each event a webhook is subscribed to.
Every event is built from the same event structure: a common top (event type, summary, the affected entity with its name, connection and link) plus event-specific details, where details.items is the list of result rows - profiling rules, test cases of a suite run, changed entities of an audit, or dropped objects of a schema delete. details.items_truncated carries the count of rows left out.
By default only failed and errored rows are included, at most 50 of them, so passing checks show up in the aggregate counts and percentages rather than as rows. Both of those are per-webhook settings - see Item configuration to include passing rows or change the row count. Test-case-failure events always keep their row (it is the failure that triggered the event), and audit / schema-delete rows have no status to filter on; those are capped at 50 rows regardless of the configured limit.
Placeholders that resolve for every event type:
${summary}- human-readable summary of the event${event_type}-TEST_SUITE_RESULT,PROFILING_RESULT,TEST_CASE_FAILURE,ENTITY_UPDATED,ENTITY_DELETED,ENTITY_RESTORED, orSCHEMA_DELETED${object_type}- entity type (TEST_SUITE,PROFILING,TEST_CASE,OBJECT,TERM,SCHEMA)${name}- entity name (joined names on bulk change events). For profiling events this is the profiling's own name, which can differ from the table it reads - several profilings of one table are told apart by it${connection}- connection name${url}- link to the entity in the application${timestamp}- time the event was sent
Dotted paths reach any field of the event structure, e.g. ${entity.id}, ${details.failed}, ${details.suite_name}. Placeholders that do not apply to the current event type render as an empty string.
Execution events (TEST_SUITE_RESULT, PROFILING_RESULT) additionally resolve ${passed}, ${failed}, ${error} (percentages) and ${report_url} - an authenticated download URL for the report, distinct from ${url} which deep-links into the UI.
Repeating rows: wrap a fragment in ${items}... ${/items} and it repeats once per result row. Inside the block, row fields resolve by name - for example ${column}/${rule}/${result} on a profiling result, or ${description}/${status}/${expected_result} on suite results and test case failures. The legacy ${test_cases}... ${/test_cases} block keeps working for test suite results.
Structured JSON: use "${details_json}" or "${event_json}" as a complete string value and it is replaced with the event details (or the whole event) as real nested JSON - the easiest way to feed automation tools (n8n, Zapier, internal services) everything the event carries, e.g. exactly which profiling rules failed on which columns.
Item configuration
The Item configuration section in the webhook editor controls the ${items} rows of that webhook's payloads:
Items limit - the maximum number of rows in a single payload (1-200, default 50). Rows past the limit are counted in
details.items_truncated.Item statuses - which result statuses are included: Passed, Failed, Error, Not executed. The default is Failed + Error. Rows keep their ordering regardless of the selection (failures first).
Both settings apply to the live preview and to the Test webhook button, so what you see while editing is what a real alert sends.
Sample templates
The webhook editor ships with ready-made body templates - click a template chip above the JSON editor to load it, then customize as needed:
Universal - summary + link; renders sensibly for every event type.
Failed rows list - summary plus one line per failed row via the
${items}block.Simple text - flat text payload with a
textfield; works with any service that renders Markdown in chat messages.Slack - blocks with buttons - Slack Block Kit payload with summary text and two action buttons (View results, Download report).
Slack - results table - Slack payload rendering the result rows as a table.
Slack API - table (bot token) - variant for posting via the Slack API with a bot token.
Microsoft Teams - Adaptive Card payload with a fact set and open-URL actions.
Structured JSON - flat JSON object with one key per placeholder plus nested
details. Useful as a starting point for arbitrary REST endpoints (Jira issue creation, PagerDuty, internal services, etc.) where you can map the fields to whatever the target API expects.
Editing webhooks
Click on webhook you want to edit
Refer to Adding webhooks.
Event log
The Event log sub-tab records every outbound alert delivery - webhook POSTs and alert emails (including test sends) - with the transport's response:
Webhooks: the HTTP status and (truncated) response body, or the failure message when the endpoint could not be reached.
Emails: the SMTP server's acceptance reply (e.g.
250 2.0.0 OK) or the failure message. Note that an accepted hand-off means the mail server took the message, not that it reached the inbox - bounces happen later, out of band.
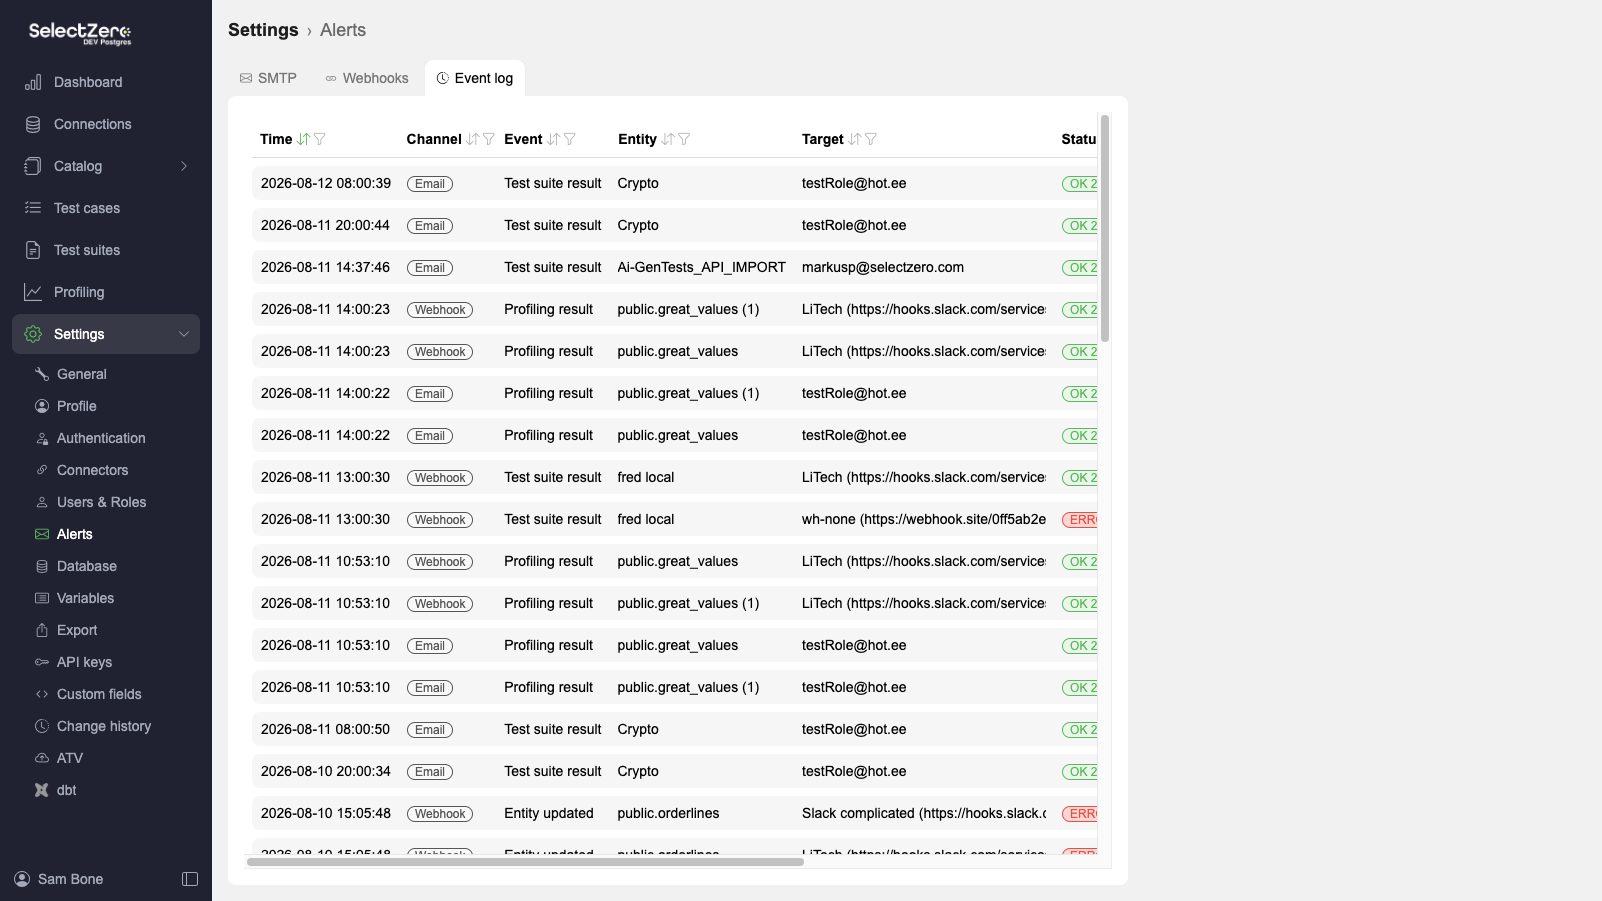
Each row carries the event type, the entity that triggered the alert, the target (webhook or recipient list), status, response, and duration. The table supports filtering by channel, event type, status, entity/target text search, and date range. The webhook editor has the same log scoped to that webhook on its own Event log tab.
Retention is controlled by two settings in General settings → Retention: Alert event log history (days) and Alert event log max rows (a global cap where the oldest rows are pruned first).
Managing user alerts
Admins can review and manage every alert subscription in the system via the Manage user alerts button in the SMTP sub-tab's User alerts section
The table lists one row per subscription, with these columns:
Recipient - the subscriber: a user, a webhook, or an external email
Type -
Test case,Test suite,Term,Object,Profiling, orSchemaEntity - the entity the recipient is subscribed to; clicking it opens the entity's detailed view
Scopes - which kinds of events trigger an alert for this subscription (see below)
Created - when the subscription was created
The table supports text search by recipient, text search by entity name, and multi-select filters on type and scopes.
Alert scopes
Each subscription has one or more scopes that decide when it fires. Which scopes are available depends on the object type:
Object type | Available scopes |
|---|---|
Test case | Change alerts, Failure alerts |
Test suite | Failure alerts |
Term | Change alerts |
Object | Change alerts |
Schema | Change alerts |
Profiling | Failure alerts |
Failure alerts - fires when an execution of the entity reports a failure (or below the configured threshold)
Change alerts - fires when the entity's configuration is changed (edits, renames, deletes)
Editing a subscription
Click any row to open the edit modal. Toggle the scopes you want and Save. Removing every scope unsubscribes the recipient from that entity (an inline warning is shown before saving). Admins can also select multiple rows with the row checkboxes and remove them with Delete selected, which carries the count and asks for confirmation.
My alerts
Every user has a My alerts sub-tab under Settings → Profile with the same table, filtered to their own subscriptions. The columns are the same, minus the Recipient column, and they can edit or remove only their own subscriptions.